

“This sounds great, but how do we know it’s effective at embedding learning into day-to-day work? How can we measure it?” These are the age-old questions L&D professionals hear from executives when proposing immersive business simulations. In other words: How do we prove this investment moved the needle? Answering that question requires turning rich experience into hard evidence. In this post, we explore how to measure the ROI of experiential learning – specifically business simulations – using Kirkpatrick’s Four Levels of Evaluation and the Balanced Scorecard framework.
The ROI Measurement Challenge in Experiential Learning
Immersive simulations are engaging and effective learning experiences, but stakeholders want proof of impact. It’s not enough to rely on “woolly” intangible benefits or positive participant feedback alone. If a training program only delivers happy smile sheets yet no observable change in performance, was it worth the time and cost? Research on learning retention underscores this challenge: without reinforcement, people forget roughly 80% of learning from traditional training methods. By contrast, immersive or experiential learning can dramatically improve retention – studies report 75–90% retention rates from immersive training versus as low as 10% from reading or lecture-style instruction. That means simulations can embed knowledge far more effectively than conventional methods. As one example, experiential learning “learn by doing” approaches drive high engagement and create lasting connections.
However, effectiveness in principle doesn’t automatically satisfy a CFO. To prove ROI, we need to connect learning outcomes to real-world results. Elton Daddow – Immersive Edge’s Commercial Director – points out a common pitfall: many program owners focus only on immediate learning outcomes and ignore the business outcomes the program was meant to achieve. The key is measuring both. “To evidence real ROI, both [learning and business outcomes] must be considered equally.” In practice, that means evaluating how well people learned and whether that translated into on-the-job behavior changes and improved organizational metrics.
Kirkpatrick’s Four Levels: From Reaction to Results
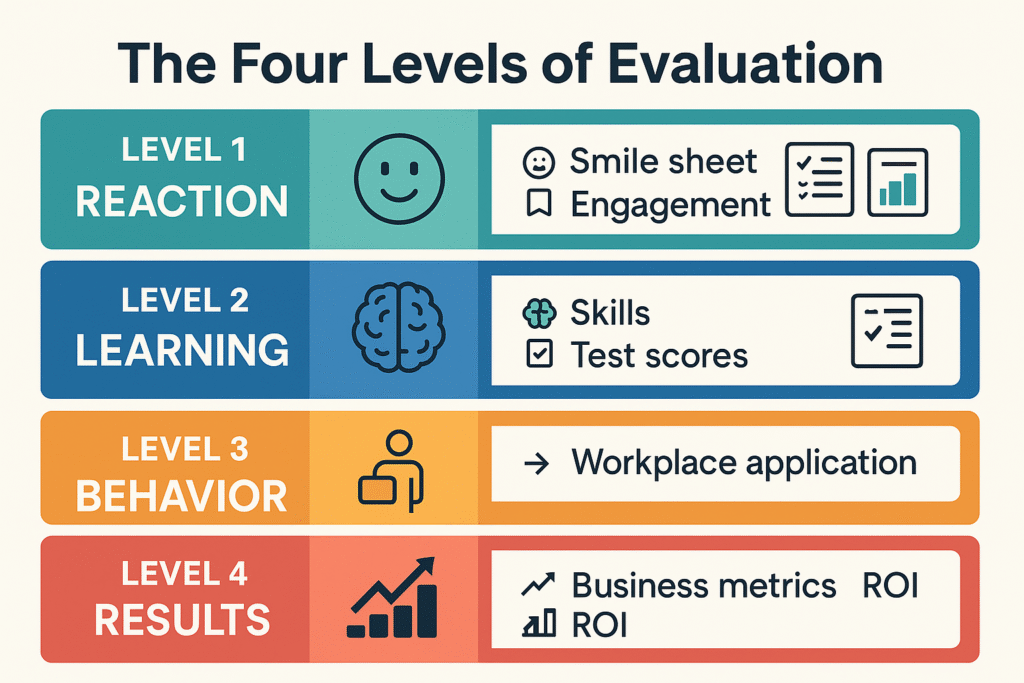
One well-established model for evaluating training impact is Kirkpatrick’s Four Levels of Evaluation. It gives a structured way to collect evidence at progressive levels, from the participant’s initial reaction up to organizational results:
- Level 1 – Reaction: Did participants find the simulation useful, engaging, and relevant? We gather this via immediate feedback forms or “smile sheets” to gauge satisfaction and perceived value. Positive reactions alone don’t prove impact, but they do indicate engagement (a foundation for deeper learning).
- Level 2 – Learning: Did participants actually learn the intended knowledge, skills, or behaviors? We measure this through assessments – for example, pre- and post-simulation quizzes, team performance scores in the game, or skill demonstrations. An experiential simulation often builds business acumen and soft skills; a Level 2 evaluation might show improved financial literacy or communication effectiveness right after the training.
- Level 3 – Behavior: Are participants applying what they learned back on the job? This is about behavior change on the ground. It can be assessed via observations, follow-up 360° feedback, or performance reviews weeks or months later. For instance, after a leadership simulation, do managers actually coach their teams more and break down silos? Level 3 is critical – it checks if the learning transfer occurred. (Notably, if behavior hasn’t changed, it might not be the training’s fault; sometimes workplace barriers prevent new practices.)
- Level 4 – Results: Ultimately, did the training move the needle on key business outcomes? This level looks at organizational KPIs and performance metrics that the training was meant to influence. For a business simulation, that could include metrics like sales growth, product quality, customer satisfaction scores, error rates, or even employee retention – whatever “success” looks like for the initiative. At Level 4, we ask: What changed in the business as a result? For example, did a simulation-driven customer service training improve customer NPS scores or reduce response times?
Kirkpatrick’s model helps us gather evidence from immediate smiles to bottom-line impact. But to truly convince senior leadership of ROI, Level 4 is where we need to shine – connecting the training to the metrics executives care about. This is where the Balanced Scorecard comes in.
The Balanced Scorecard: Linking Learning to Strategic Outcomes
While Kirkpatrick Level 4 tells us to look at results, the Balanced Scorecard (BSC) gives a broader framework for which results to measure. The Balanced Scorecard, originally developed by Kaplan & Norton, is a strategy execution tool that measures organizational performance from four key perspectives: Financial, Customer, Internal Process, and Learning & Growth. In the context of L&D and simulations, it ensures we’re aligning training outcomes with the organization’s strategic goals across these dimensions:
- Financial Perspective: How did the simulation training affect the financial bottom line? Here we quantify training ROI in hard numbers – for example, increased revenue, higher productivity, cost savings, or efficiency gains attributable (at least in part) to the learning program. We can use a formula like ROI% = (Net Benefits ÷ Cost of Training) × 100 to calculate return, but beyond that, the BSC financial lens tracks metrics like sales growth, profit margins, or reduced error costs post-training.
- Customer Perspective: How did the training impact customers or clients? This could be measured through customer satisfaction surveys, Net Promoter Scores, quality ratings, fewer complaints, faster delivery times, etc. If a simulation targets customer service skills, improvements here should show up as happier customers or improved service metrics.
- Internal Process Perspective: How did it improve our internal processes and operations? This might involve metrics like speed of project delivery, error rates, innovation rates, or cross-team collaboration efficiency. Simulations often aim to break down silos and improve workflows. We’d look for evidence such as shorter cycle times, better decision-making, or increased output quality after the training.
- Learning & Growth Perspective (Organizational Capacity): How did the simulation enhance our people and future capabilities? This includes metrics on employee engagement, retention of top talent, skill development, leadership pipeline strength, and cultural indicators. It’s essentially measuring if the workforce is more capable and prepared to drive future success because of the training. For example, an increase in employee engagement survey scores or a higher rate of internal promotions could be linked to an experiential learning program. This perspective recognizes that intangible gains in knowledge and culture are leading indicators of future performance.
The Balanced Scorecard’s four-perspective framework links improvements in people and processes to outcomes in customer satisfaction and financial results. In a business simulation context, this means training interventions (bottom two layers) are ultimately tied to better customer and financial metrics.
Using a Balanced Scorecard approach alongside Kirkpatrick ensures that when we say “ROI,” we’re not just talking about one narrow metric. We’re examining a balanced set of outcomes. For instance, a simulation might primarily target internal process improvement (e.g., team decision-making efficiency), which in turn should enhance customer experience and financial performance. By measuring indicators in all four areas, we create a richer evidence tapestry showing how the simulation drove value.
Combining Kirkpatrick & BSC: From Learning Experience to Business Evidence
How do these two models work together in practice? Think of Kirkpatrick as the way we collect data at different levels (immediate feedback, learning test scores, behavioral changes, business metrics), and think of the Balanced Scorecard as a way to organize and link those metrics to strategic goals. Together, they answer both “Did people learn and change?” and “Did those changes impact what we care about as a business?”
In fact, the Kirkpatrick framework can be directly mapped onto Balanced Scorecard metrics. Kirkpatrick’s four levels can guide the development of KPIs for each perspective of the Balanced Scorecard. For instance, Level 1 (Reaction) might be tied to an internal process metric like training attendance or engagement rate; Level 2 (Learning) could be linked to a Learning & Growth metric such as certification rates or assessment scores; Level 3 (Behavior) might connect to internal process improvements (e.g. faster project completion, better teamwork scores); and Level 4 (Results) obviously aligns with customer and financial metrics (higher sales, lower costs, etc.). Over time, organizations can refine their KPIs to increasingly emphasize the higher Kirkpatrick levels – i.e. more weight on behavior and results indicators – to truly gauge performance impact.
Hiscox, the FTSE-250 insurer, recently swapped 60 hours of classroom underwriting for a desktop scenario game (Attensi) that lets mid-level underwriters practise tricky broker conversations. Post-programme quizzes showed a 93 percent knowledge-gap closure (Level 2) and more than 80 percent of learners felt visibly more confident discussing risk with colleagues and brokers (Level 3). On the scorecard’s internal-process line the pay-off was huge: slashing training time from 60 hours to three freed the equivalent of £4,000 of productive capacity per underwriter. Multiply that by the 400 staff who took the course and the bank has £1.6 million in extra underwriting hours before it even counts better loss ratios .
Even heavy industry feels the impact. Volvo Construction Equipment trains hauler operators on a desktop-plus-controls simulator before they climb into real machines (ForConstructionPros). Operators who mastered the virtual drills (Level 2) carried those habits into the quarry, delivering a 5 percent productivity lift and a 10 percent cut in fuel burn (Level 4 Internal-Process and Financial wins). Fuel is about 40 percent of a hauler’s running cost; saving ten percent slices $40,000 from a typical site’s annual bill.
Turning Simulation Outcomes into Data: Immersive Edge’s Approach

At Immersive Edge, we recognized early that a simulation’s value must be observable and measurable. That’s why our simulations are built with capability matrices and behavioral outcomes at their core. Each Immersive Edge simulation is underpinned by a maturity index – a set of capabilities (skills or behaviors) with five levels of proficiency, from novice to advanced. For example, in a Teamwork.Inc simulation, we might track capabilities like Communication, Collaboration, Decision-Making, and Financial Acumen. Each has clear descriptions of Level 1 (basic awareness) up to Level 5 (expert/leadership level) behaviors. As teams play the simulation, our facilitators observe and chart participants’ progression through these capability levels. Are they moving from siloed communication to proactively sharing information across departments? From identifying obvious risks to strategically mitigating future risks? These observations provide quantitative and qualitative data (scores, notes) on Level 2 and 3 – what was learned and demonstrated during the experience.
Crucially, we don’t stop when the game ends. After a simulation session, our facilitators lead a real-world mapping exercise. They take the insights and “connect them to [the participants’] workplace functions,” translating the learning into specific follow-up actions on the job. In other words, we bridge the gap to Level 3/4 by ensuring participants apply their new strategies and behaviors in their actual roles. For instance, if during the simulation a team realized the importance of cross-department communication, the real-world mapping might create an action item like “implement bi-weekly inter-departmental stand-up meetings.” This step is key to driving behavior change and results once everyone is back at work.
We also often design the simulation scoring to mirror business metrics. In our Culture.Inc simulation, for example, teams are assessed via a balanced scorecard in-game – balancing Financial results with a “Maturity” score (team development) and stakeholder metrics like NPS (Customer) and eNPS (Employee engagement). This not only makes the scoring meaningful to the business context, but it produces evidence: if a team’s balanced scorecard improves from round to round, it signals learning and behavior change. And later, we can compare those areas to real workplace metrics (did employee engagement actually improve? did financial performance tick up?).
By mapping simulation performance to capability metrics and real KPIs, we create a chain of evidence from the learning experience to business outcome. It’s essentially a microcosm of Kirkpatrick+BSC: the simulation provides rich Level 1-2 data (engagement and learning within the game), we observe Level 3 behaviors in a safe environment and push those to the real world, and then measure Level 4 impacts with the client’s Balanced Scorecard or success criteria.
Proving the Needle Moved
At the end of the day, business leaders want to know: did this training deliver? By using Kirkpatrick’s levels of evaluation to systematically gather data, and framing those results in a Balanced Scorecard tied to strategic goals, you can confidently answer, “Yes – and here’s the evidence.” Instead of vague claims, you’ll have participant feedback scores, knowledge gain statistics, behavior change observations, and concrete performance metrics to show.
More importantly, you’ll tell a cohesive story of impact. The reaction was great because the training was relevant. People learned new skills, and they applied them on the job, supported by coaching and a conducive culture. Those new behaviors led to measurable improvements in key business areas – which ultimately tie back to the organization’s objectives. When done right, it’s a compelling narrative from experience to evidence: “Our global retail client saw simulation-trained teams break down silos, which improved on-time project delivery by 20% and boosted customer satisfaction by 15 points – directly supporting their strategic goal of operational excellence.” That kind of statement gets attention in the boardroom.
In summary, proving the ROI of business simulations isn’t an insurmountable task. It requires forethought in program design (know what you need to achieve and measure), use of proven evaluation models, and alignment with business metrics. By focusing not just on what participants feel or learn, but also on how they behave afterward and what results occur, you build a compelling case. Immersive Edge ensures simulations are mapped to capability outcomes and real-world application precisely for this reason – so you can see movement on the dial, not just in theory but in practice. When experiential learning is measured this rigorously, the next time someone asks “How do we know it worked?”, you’ll have a great answer ready, backed by data and strategic insight.
Now go forth and play – and don’t forget to measure!